A while back, I attended a Euchre Night hosted by some friends. They set up a tournament style event where each player was partnered with each other player once. I thought, “They set this up like a controlled experiment.” Then I wondered if I could analyze the scores to see if they were predicted by random chance.
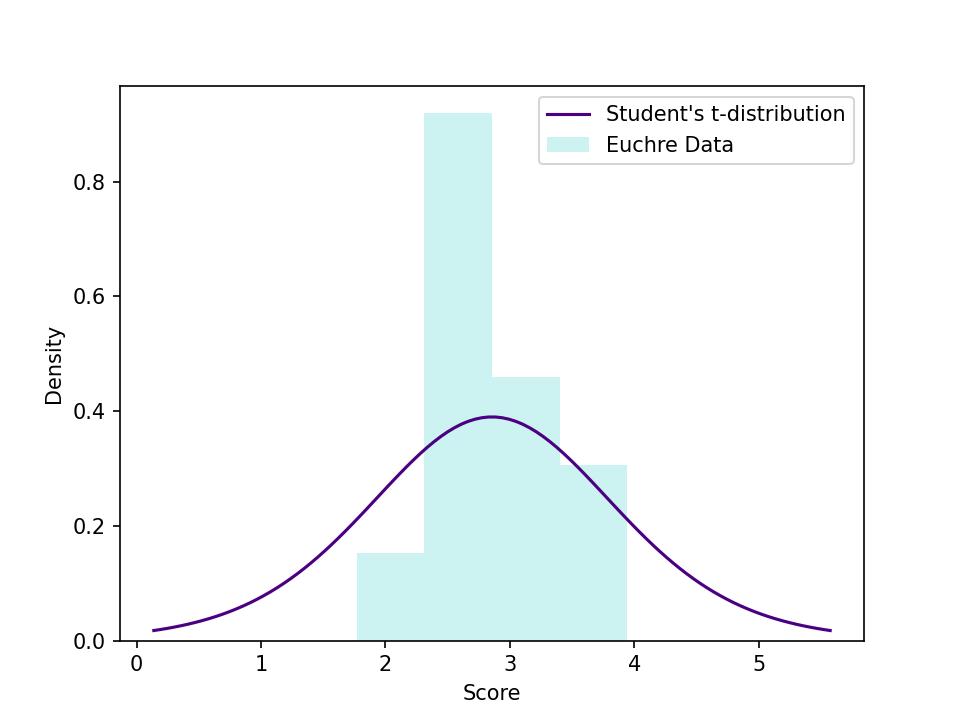
There were 12 average scores, each comprised of scores from 11 rounds, so it seems reasonable to compare to the Student’s t-distribution with 11 degrees of freedom. How reasonable? I looked at a histogram of the frequency densities plotted with the t-distribution probability densities. With few points and relatively few bins, the comparison isn’t convincing evidence that the data follows a t-distribution. It does pass my personal test for plausibility.

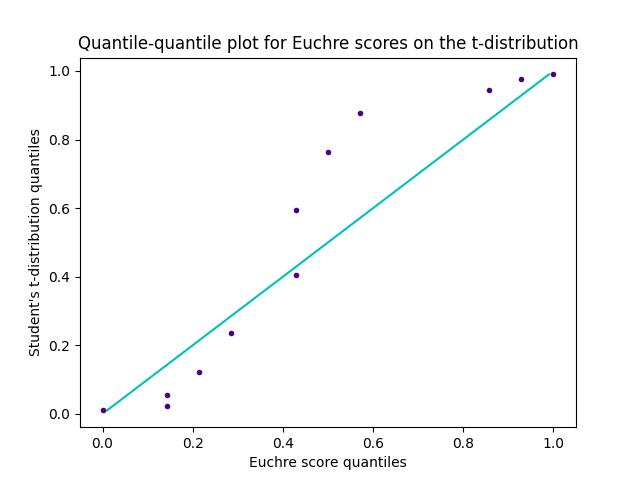
In cases like this, I like to turn to a quantile-quantile plot for a visual indication of how the data matches the distribution. I made one comparing the scores to the the Student’s t-distribution. It’s not an exact match. The scores below the median are a little low and those above the median a little high. Nonetheless, there’s no question that I’ve seen worse quantile-quantile plots. I can reasonably address my question about skill with a t-test. If the highest score is much higher than I would expect based on the t-distribution, I can conclude there is probably some skill involved.

The average scores for the evening ranged from 2.3 points per round to 3.5 points with a mean of 2.9 and a standard deviation of 0.4. The calculated t value for the top score was 5.7. The critical value for t-distribution with 11 degrees of freedom indicating a 95% confidence level is just 2.2. The probability of this score resulting by chance is about 70 parts per million. This is enough to convince me that there is skill involved in the game of Euchre!
Next, I’ll have to figure out just how important a good partner is, statistically speaking.


6 responses to “A Game of Skill? Euchre Night Part 1”
Interesting info. There IS some skill involved, but it’s more likely that high scores correlate to good cards! It’s much easier to look like a skillful player with a hand full of trump and an off-suit ace, and you cannot win rounds with low non-trump cards!
Good point! I would expect this to even out on average over a whole night of play since each player is dealt 44 different hands over the course of the tournament. I plan to do that analysis next.
I need to to thank you for this good read!! I certainly loved every bit of it. I have you bookmarked to check out new stuff you postÖ
Thanks! Glad you enjoyed.
Itís difficult to find experienced people for this topic, but you seem like you know what youíre talking about! Thanks
An intriguing discussion is worth comment. I do think that you should publish more on this topic, it might not be a taboo subject but generally people dont speak about such subjects. To the next! Cheers!!